

We test frontier models on 40 investment banking tasks, from LBO models to sell-side M&A work. With the help of expert contributors, we built detailed tasks, grading rubrics, and data rooms. The results show that even top models struggle to complete agentic investment banking work in our environments, with the best model achieving only 8% Pass@1.
Introduction
AI agents are becoming scarily good at using tools. Claude Cowork and OpenClaw are great examples of this - our Clawdbot works alongside us practically as a virtual employee, helping us manage contributors, push code changes, and automate key internal processes. We believe this step-change in ability is driven by a few key trends:
New paradigms for managing hundreds of tools. How should an agent interact with the world? We think MCP has several drawbacks (bloating context, brittle schemas) and new paradigms have emerged. In our environment, we load tools on-demand and let agents interact with a filesystem directly.
LLMs are better at managing long context. It’s more than bigger context windows. Real banking tasks require synthesizing information across long PDFs and messy financials. Agents are better at staying coherent across long horizons without losing track of goals and constraints.
File outputs > chat responses. In the real world, your output isn’t a paragraph. It’s a spreadsheet, a slide deck, a PDF memo, or a code repo. If we only evaluate agents on text responses, we’re testing the wrong thing.
Why investment banking?
We set out to build an environment around these trends: dynamic tool use, long-context reasoning, and file-based outputs. Investment bankers:
- Work within a VDR (virtual data room)
- Synthesize information across long, messy financial documents
- Produce structured file deliverables (models, decks, CIMs)
There’s evidence to back this too. Investment banking is becoming a proving ground for AI. McKinsey estimates generative AI could improve productivity in corporate and investment banking by 30–90%, while Deloitte projects 27–35% front-office productivity gains by 2026. Industry research suggests AI could shift bankers’ time from manual execution to higher-value judgment, strategy, and deal structuring. Yet most banks lack rigorous evaluation frameworks that reflect real-world complexity, creating a gap between AI promise and trustworthy performance. Playgent closes that gap with realistic environments and robust benchmarking tailored to investment banking workflows.
Playgent-IB-Bench
Model Performance on PlaygentIB
Notes
We report the average normalized score, computed as agent_reward/total_rubric_reward per task, averaged across tasks. A score of 1.0 indicates perfect performance on all evaluated tasks.
Even the best model scores only 0.36 on average, well below human expert level. These are genuinely hard tasks that require multi-step planning, domain knowledge, and precise file outputs.
Open-weight models score near zero, highlighting the current frontier gap on complex, multi-tool finance workflows.
Many benchmarks today are focused on answering hard finance questions (e.g. FinanceQA). This is great, but it’s a precursor to training agents that do real work. What differentiates a college student with straight As in finance classes from an Associate at Goldman Sachs? The associate has worked on live deals where they find inputs from noisy documents, reconcile conflicting numbers, and make the right assumptions under uncertainty.
We built Playgent-IB-Bench to bridge this gap. In our RL environment, we:
- Use real data that mimic actual deals
- Seed environments with lots of context, requiring agents to pull data from multiple sources to create comprehensive outputs and accurately solve tasks (e.g., transactions, loan terms, 3-statement models)
- Provide our agent with 58 workspace-level tools to explore files, read PDFs, modify spreadsheets, write documents
- Every task has a file deliverable (e.g., Excel workbook, Word document) with expert-curated rubrics and verifiers
PlaygentIB contains 40 tasks across 9 worlds. A world is a data room seeded with folders and files representing a scenario our experts came up with. Every task is scoped to have a single key deliverable. Our worlds+tasks are grouped into relevant sub-domains, and expert teams for each sub-domain were specifically sourced with demonstrated experience in that area.
| Metric | Value |
|---|---|
| Total tasks | 40 |
| Worlds (data rooms) | 9 |
| Files per world | Median 18* |
| Avg prompt length | 46.43 words |
| * Avg skewed by 2 very large worlds, so median reported | |
Our end-to-end process
We built this environment using our network of expert contributors. We interviewed experts through 4 different agencies and only accepted 14% of applications. We also built Playgent Expert Interface, our platform for expert contributors where we coordinated all task completion (tracked via Google Drive API) and quality assurance loops.
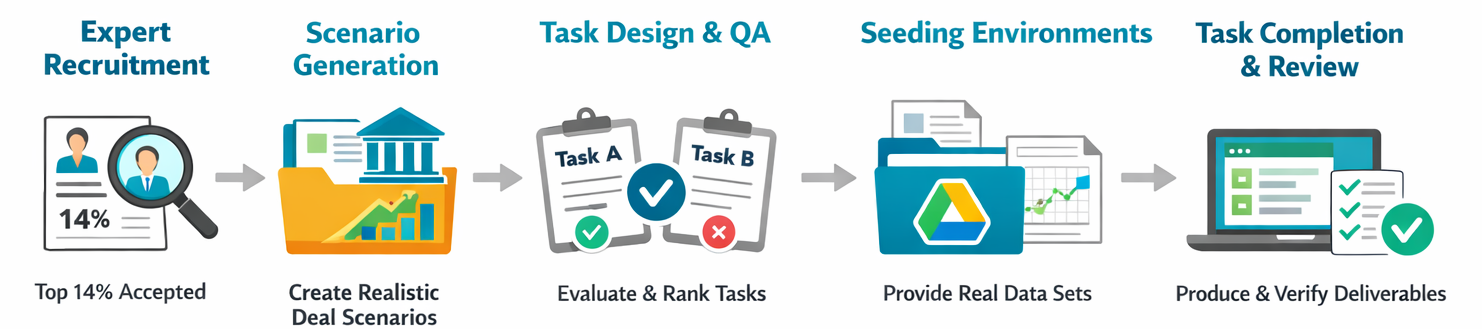
Scenario Generation
Each expert was tasked with coming up with a scenario modeling a deal they have worked on in the past. A scenario is defined as a client+project for an investment bank. For example, “sell-side M&A of Juniper Networks.” Experts were encouraged to choose scenarios where all data can actually be procured. Our contributors cover a wide range of experience, from private company mergers with messy data to multi-billion dollar deals.
Designing Tasks
The expert who created each scenario was also asked to define multiple complex tasks per scenario. Since scenarios were created based on the expert’s real experience, we asked them to define tasks that were actually done when they were on the project. We guided task creation with a few key guidelines:
- Every task must clearly define ONE output deliverable
- Every task must reference the specific company in the scenario
- Every output deliverable must correspond to real deliverables used in investment banking
- Any assumptions that are NOT discoverable from data must be provided in the task prompt
Build a full 5-year LBO model (base case) for Juniper Networks using the attached CIM, assuming a 6.5× entry EBITDA multiple, 65% debt financing at L+450 with a 7-year term loan, and 2% annual revenue growth. Output a summary returns table showing IRR and MOIC at exit multiples of 5.5×, 6.0×, and 6.5× EBITDA, along with a debt paydown schedule.
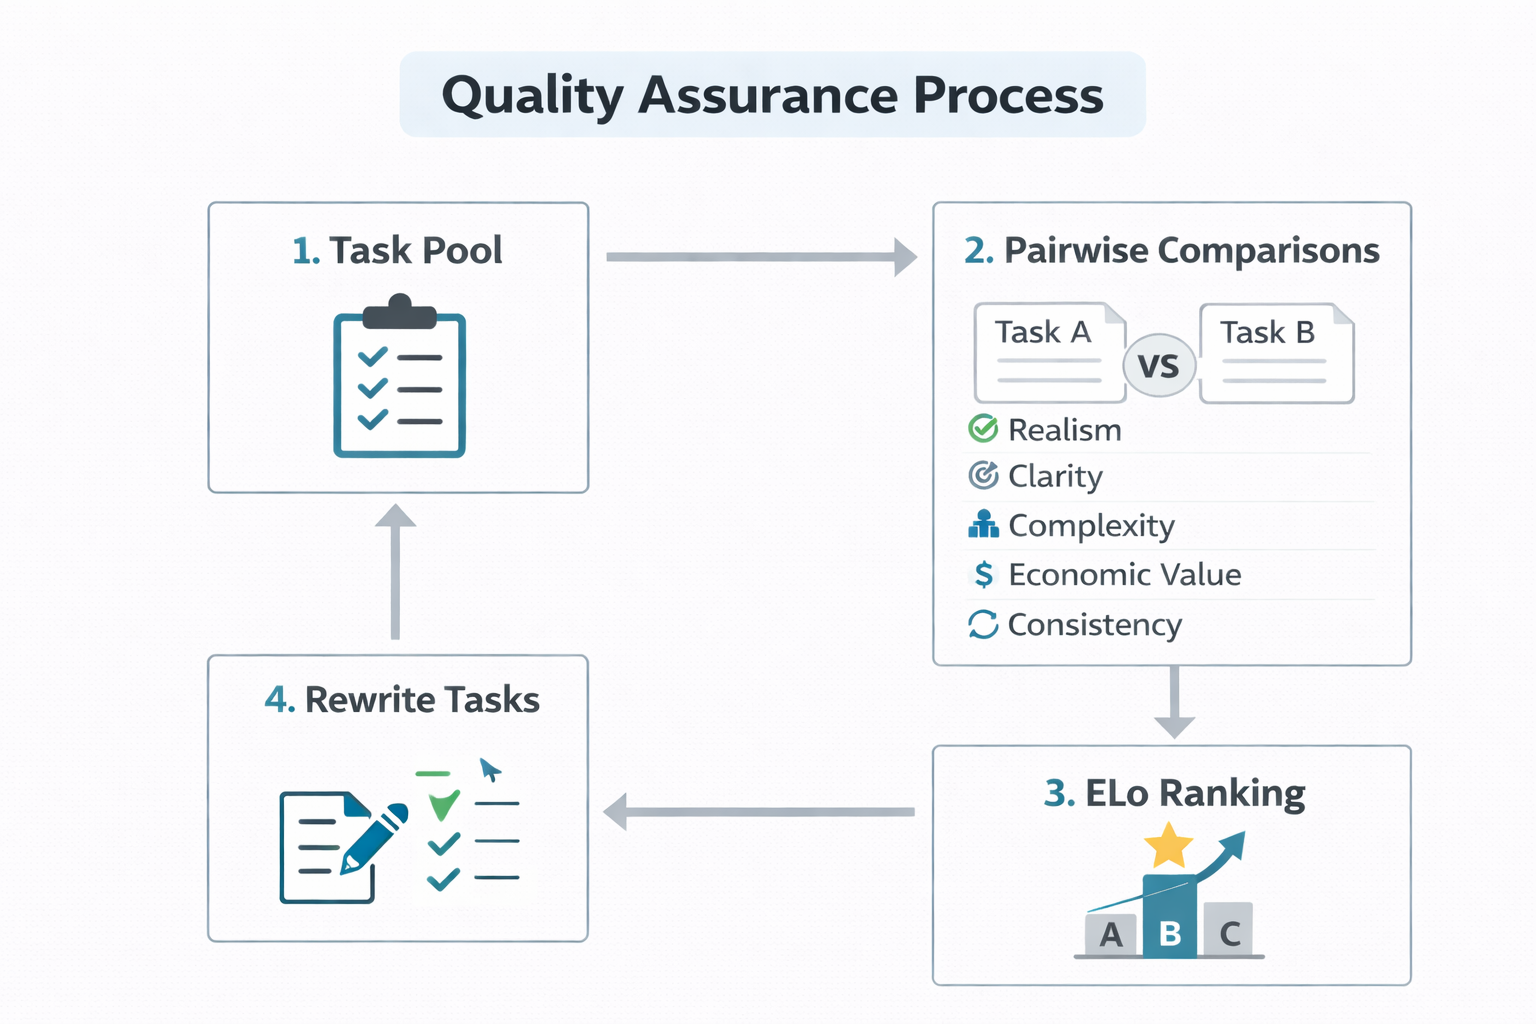
Quality Assurance
We randomly sampled pairs of tasks such that each task was pitted against 10 other ones, and presented them to our experts. Each expert chose between Task A, Task B, and Tie across these dimensions:
- Realism: Which task is more realistic based on your professional investment banking experience?
- Clarity: Which task is more prone to misinterpretation?
- Complexity: Which task requires more steps to complete?
- Economic Value: Which task output is more valuable if an AI could reliably perform it?
- Solution Consistency: Which task has a more consistent solution (one correct answer)?
Also, for every dimension, experts were given a free text-input to say what (if changed) in the losing task would make it a tie/win.
We aggregated these pairwise preferences into a global ranking of tasks through Playgent Task Arena. We fit a Bradley-Terry model via maximum likelihood estimation (MLE), where the winning task in each comparison was determined by its total points across the 5 dimensions (+1 for a win, 0.5 for a tie). After each round, we sent all tasks which had feedback back to the original task author for changes. It was up to the original expert’s discretion to implement the changes or not, but we mentioned losing tasks would not be included in the final dataset.
We performed 3 rounds, and then filtered out the bottom 62% of tasks based on their Elo rating. Here is a breakdown of our QA filtering process:
| Metric | Value |
|---|---|
| Initial tasks submitted | 106 |
| Pairwise comparisons per task | 10 |
| Total evaluation rounds | 3 |
| Tasks receiving structured feedback | 35 |
| Final retained tasks (Top 38%) | 40 |
| Final removed tasks (Bottom 62%) | 66 |
We also computed dimension-level scores for each task, defined as the proportion of wins across each dimension. This means a task with Realism score 0.8 wins 80% of the time on realism when pitted against other tasks.
Avg. Dimension Win-Rate (Retained Tasks)
Notes
For each task and dimension, we compute the proportion of pairwise points earned, defined as (wins + 0.5 × ties) / total comparisons. The reported score is the average of these proportions across retained tasks. A value of 0.5 corresponds to equal expected performance against opponents.
Seeding Environments
We sent the winning tasks back to the original authors to seed an environment. Task authors used realistic materials: financial model templates, documents that mirrored what they had seen on similar deals, and relevant articles from the Internet downloaded as PDFs. Experts were required to include all information to do the task as part of the environment, which we exposed as a Google Drive folder through our platform.
Performing Tasks
Once experts seeded environments, experts completed each task and produced golden deliverables. Experts worked inside a Google Drive folder where all their actions were tracked through the Playgent Expert Interface. Furthermore, experts were asked to break their work down into timestamped checkpoints where they explained their reasoning, key nuances, and how they updated the deliverable file.
Verifiers and Rubrics
| Dimension | Example | Reward |
|---|---|---|
| Value | Cell C9 (takeover_price) = 45 | +1/1 |
| Value | Cell C10 (debt_financing) = 0.5 | 0/1 |
| Formula | C18 uses =C14*12, not hardcoded exit price | +2/2 |
| Formula | C13 uses =C9*(1-C10) for equity_investment | 0/2 |
| Format | C9 has input_blue | 0/1 |
| Format | C13 has formula_black | +1/1 |
After each task was completed, we reviewed the expert’s checkpoints and created a rubric that defines what correct work looks like. Drawing inspiration from the Rubrics as Rewards (RaR) framework, we designed rubrics across three dimensions:
Value correctness — Verifiers check for specific value matches in key cells, as verified by at least two experts. These are simple checks that determine whether the model got the right value in the right place.
Formula correctness — Verifiers check whether the agent used formulas to compute values in key cells, rather than pasting raw values that produce a static, unusable model. We evaluate the agent-written formula on the gold spreadsheet and verify it yields the correct value. This rewards models that write correct formulas even when an upstream error causes value verifiers to fail.
Formatting — Verifiers check that key output cells follow widely-accepted investment banking conventions: raw inputs in blue, formulas in black, negative numbers in parentheses, etc. The template provides formatting hints, but these verifiers ensure the model actually applies them consistently.
Limitations
More complex tasks exist. The benchmark covers a range of M&A and modeling workflows, but real banking involves even more multi-step, cross-document tasks that we have not yet captured.
Verifiability vs. judgment. This environment prioritizes tasks with clear, verifiable outputs. Investment banking is as much an art as it is a science. Nuance, client judgment, and strategic framing matter. Preference data from expert comparisons could be highly valuable for evaluating these softer dimensions.
Tool coverage. We can expand MCP integrations with key banking software such as FactSet and AlphaSense to better reflect how analysts work in practice.
Conclusion
The results are clear: even top frontier models struggle on these tasks. There is still a large gap between “knowing finance” and “working in finance.” That gap represents both a challenge and an opportunity. We believe reinforcement learning in structured, domain-specific environments is the path to closing it.
If you’re in finance and want RL environments, email us at founders@useplaygent.com.
@misc{playgent2026ib,
  title        = {Evaluating AI Agents on Investment Banking Tasks},
  author       = {Playgent Team},
  year         = {2026},
  month        = {feb},
  howpublished = {\url{https://playgent.com/blog/investment-banking}},
}